The COVIC Pandemic: We Need to Be Watching Hospitalizations
- Analogica

- Nov 10, 2020
- 1 min read
The doctors have noted all along that there is a time sequence in the measures of COVID-19 that we need to watch. The July 8 post below worked out a time lag between cases and deaths of about 18 days.
There is also a time lag, somewhat shorter, between a positive coronavirus test and hospitalization due to worsening symptoms. Both these lags have a wide range, but the outcomes still seem to be visible in the aggregated data.
The following chart shows an approximation of the time lag between the day the cases are reported and the day the hospitalizations reflect the change. In periods where the numbers are fluctuating gradually in a narrow range, estimation is not possible. The marks on this chart show the definite shifts upward in both curves, which works out to about 12 days.

For a possible 12-day lag, we can then look at the ratio of current hospitalizations to cases, to see how the number of cases can be used to generate a prediction ratio.
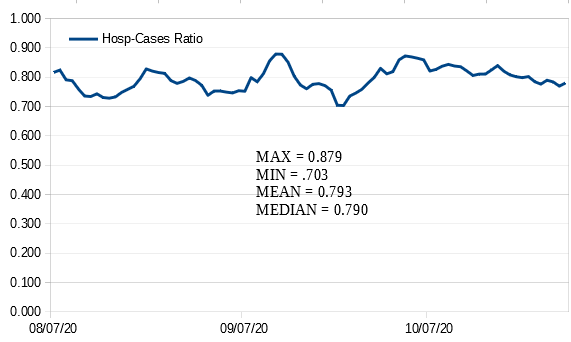
The following chart shows the ratio. There is some variation, but this occurs within a relatively narrow range, and does not show any trend markedly up or down.

Using the historical observed ratio of hospitalizations as a function of the 12-day lagged cases number, we can now predict the near term hospitalizations burden that we should expect and prepare for.
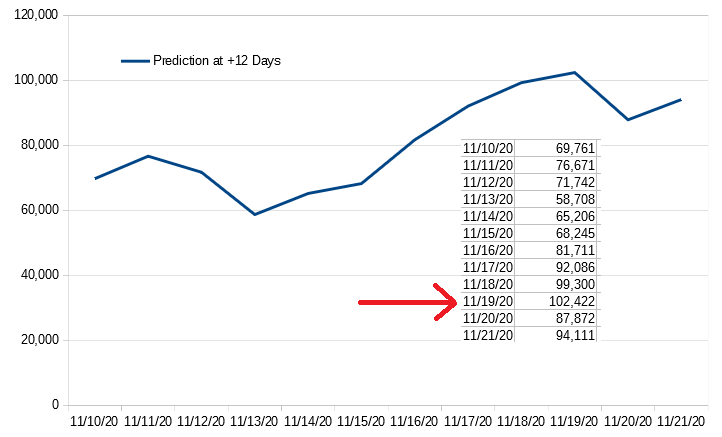
The following chart and table show a highly problematic rise in hospitalizations approaching:

The slight dip at the right end of the line is an artifact of weekend cases reporting - we should not expect a sudden group of miraculous recoveries here.


Comments